Sunday, January 26, 2014

Water and the internet of things

Over the past year on this blog I have been talking about a number of concepts around how we can become smarter about how the world uses water. I thought it would be good for this posting to take a breath and put it all together to give new and existing readers an overview of where the IBM Intelligent Water Platform (IOW) is now and its technical capabilities.


At the heart of IBM Intelligent Water Platform (IOW) is the water information hub (WIH) which provides a system view of the internet of things as related to a water or grid utilities network. This network is built up from elemental data sources such as sensors, meters, enterprise asset management systems, CRM systems, ERP systems and GIS systems. This systems view allows the user to view the water network as a whole, where the whole is greater than the sum of the parts. The water information hub is modeled using a flexible semantic technology that allows the modeling of real world water networks and can manage change dynamically. 

Smarter water enterprise applications can then be build on-top of the water information hub using a software development kit (SDK). The SDK provides a number of core services for the application developer:
  • A interface into the water information hub (WIH), 
  • A interface into the advanced analytics engines of the platform, 
  • A rendering service that allow the application developer to display result to the end user
Using these core interfaces, the platforms eventing model, and an integration with social media services an application developer can develop advanced analytical water application such as pressure management and pump energy optimization and deploy these applications into the IOW platform.

The enterprise application development pattern separates function from content using the concept of a content pack. in a model, view controller pattern. This allows an application developer and business partner to collaborate together to solve a diverse range of global water problems. In the Smarter Water SDK, the application’s content comes in the form of a content pack. We can think of a content pack as a container that holds lots of different types of content, content that can be both consumed and produced by the application, such as KPI, SOPs, and custom reports.

An organizing principle is then used to categorize and classify the applications. This classification is by vertical (e.g. Water sourcing and distribution, waste water, etc), by role (executive, planner, operator) and by business responsibility. This classification allows for multiple application to be installed and configured, as part of the application development lifecycle, into the IOW platform.

All of the services of the IOW SDK interfaces are built and offered as cloud services to allow for remote development and deployment of enterprise applications. All of the enterprise analytical applications can in turn expose and be offered as business services. These applications can then collaborate and cooperate together using their business services to help solve real world water problems such as a leaking pipe.

Wednesday, November 13, 2013

Smarter Water Application Development Lifecycle

So far we have looked at a number of concepts around the IBM Smarter Water Platform. We have looked at the water information hub (the WIH provides a systems view of the water network), the Smarter Water SDK which is built on-top of the WIH (the SDK provides the tools that an application developer needs to build water related applications), and the content packs ( the content pack provides supporting content for the application) used to support applications. Now we will put all this together and show how an water related application can be developed, installed, configured, and extended in IBM Smarter Water Platform.


The following diagram shows the end to end lifecycle of a water application developed, and deployed into IBM Smarter Water Platform
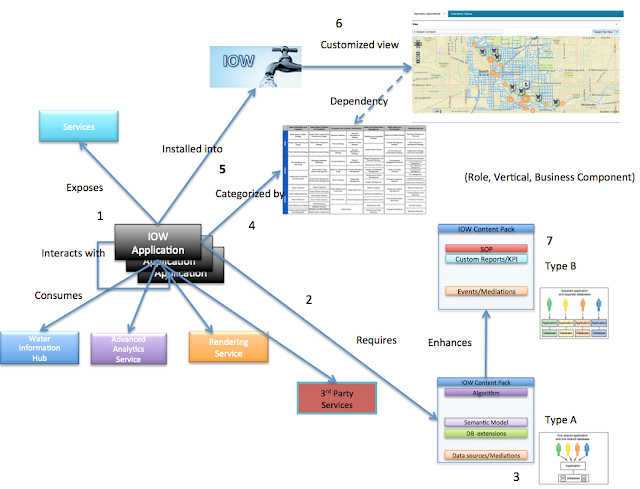
IOW app development concepts dependencies


  1. An application developer develops an water related application (app) to address a water related business need
  2. The application is supported with a content pack
  3. When developing the application, the application developer also creates app meta data such as UI extensions points which allow the application to be hooked up to the platform UI
  4. This application is categorized by vertical, role and business responsibility or component (conceptually we can think of this as the app being installed into an app store).
  5. The application can then be installed into IOW to help solve a particular business need.
  6. Based on the categorization and the UI extension points the app is customized into IOW
  7. Extend the application content pack with domain knowledge and expertise

Let us now look at each of these steps in a bit more detail. We will expose each of the step in more detail using a example pressure management application.

0. Identify the business need


Within a pressure zone, the water pressure in usually kept high to ensure that there is adequate positive pressure on the tap side. Keeping the water network at high pressure all the time has a detrimental effect on the pipe network, particularly in an aging pipe network, which is the case in most western european cities. The constant high pressure tends to corrode the pipes and also exasperates any existing leaks.

1. Develop an application to address the business problem


An application developer develops a water related app to deal with the problem. The app exposes a service to deal with the business problem. In the case of high pressure problem, a pressure management app would be developed and it would expose a business service to manage the pressure’


A pressure management application, built using SDK, will read off the pipe network and then iterate through the pipe network and read off the pressure reading at pressure critical point and then take that data and process it through an optimization algorithm. The output of the optimization algorithm will then give the optimized pressure readings for that pressure zone. The application could then write out to the optimized pressure reading to the pressure reducing valves in the water network. This pressure management app then exposes a service called ’Manage Pressure’. Once this application is deployed into IBM Smarter Water Platform (IOW) this service becomes available to be called either standalone or part other application as part of a business process or collaboration.

2. Support the application with a content pack


An application developer will also need to develop a content pack to support the app. There is a minimum amount of content to make the application functional and these content needs to be developed at this time. Note that the content in a content needs to be both multi-tenant and high availability aware. Here is the typical types of content that an app needs in order to function


Data sources - Understand the external systems (e.g. work equipment: devices, sensors, meters, etc). Identify the external system that the app needs to pull data from, or interface to, in order to function. This data is ingested over and industrial strength enterprise service bus.

For the pressure management app those type of data sources would be pipe network categorized by pressure zone, the pressure reading from the pressure critical points, and the pressure reducing values in the network.


Events - The enterprise service bus and the mediations are also responsible for handling and dealing with events. These events can be external event such as a weather event, or events from the meters and sensor devices, such as a no read. These events can also be generated by the application.

The pressure management app is interested in events such as leaks, bursts, pumps request to be serviced and also event correlations such as unknown or ’no data’ status reads from the sensors on the network.


Database extensions - Create the corresponding application specific IOW persistence stores. Based on the format of the data from the external systems, such as the measurements and measurement values from sensor or meters, the corresponding database stores need to be created within the Smarter Water Platform (IOW).

For the pressure management application, the corresponding data stores to store the measurement values for the pressure critical points and the data from the pipe network and pressure zone boundaries must be created.


Water information hub/Semantic model - Extend the IOW Semantic Model to support the clients water model. Based on the application requirements and the types of external systems the semantic model, at the heart of the Smarter Water Platform (IOW), can be extended to model these systems to provide a overall view of the water network.

Extend the IOW semantic model to understand EPANET hydraulics model (pipe network)

3. Application meta data


When developing the app, the application developer also creates meta data about the application. This app meta meta is stored as part of the content pack. Examples of the kind of meta data associated with applications would be

  • The UI extension points for the application. When an application is being installed into IOW, these UI extension points are exposed to the application installer to allow the application to be connected to the platform viewer.
  • The applications classification by vertical, role and business component or responsibility (see section 4. Application Classification below) .
  • A list of the services that the application consumes and exposes (see section 1. Develop a business application above)
  • Role based authentication and authorization access information for application services.


4. Application Classification


The application now needs to be classified and categorized by vertical, role and business component or responsibility. Conceptually we can think about this as installing the application into an app store where the application is verified and classified. This classification will help intended audience to find the application and it corresponding service(s). This classification will provide guidance as to how and where the application will be installed into IBM Smarter Water Platform (IOW).

The pressure management application would classified as follows:

Classification of the pressure management application
Vertical Water sourcing and distribution
Role Water Planner
Business component/responsibility Infrastructure monitoring and optimization
Business service Optimize pressure (the application provides a realization of this service)

This classification information is then added to application’s meta data. Also note that a pump energy optimization application would be classified the same way.

5/6. Application installation and configuration

The application installer/configurator can now install the application into IBM Smarter Water Platform (IOW). Conceptually this can be thought of as a user installing an application on their iPhone/iPad. Based on the classification of the application, the installer takes into account the application’s domain vertical, the role, the business component/responsibility and the business service being exposed. The applications configurator also configures the application extension points such as the UI extension point, localize the application, and configures time and date formats.

Based on its application classification the pressure management application would installed into a water sourcing and distribution planner page or tab and would be categorized in that page/tab under infrastructure monitoring and optimization. The pressure management application extension points would also be configured to localized the application and to hook up the UI extension points.

7. Extend the application content back with domain knowledge

App content packs can also be extended by a content pack extender, typically this is an typically a entity with domain knowledge expertise. An example of a domain knowledge expert would be water engineering company who understand the local domain (e.g. USA, Europe, South Africa, etc) and regulatory compliance (e.g. EPA regulations in the USA) that the apps needs to operate in. Again the content in the content needs to be both multi-tenant and high availability aware.

An application with a basic content pack can be extended multiple times with difference content depending on the domain that the app is deployed in. For example the pressure management app could be used by a water pump company who have pumps all over the world. The water pump company or a water engineering company that sell these pumps, can then take the pressure management app and provide difference extension to this content pack when they are using this app in Denmark and using it in the USA.

Role based security access to the content may also be added by the content pack extender to application meta data section as the content pack is extended.

Here is the typical types of content that an app can be extended with:


Key Performance Indicators (KPIs) - Create application specific KPIs
Discover, specify and implement the KPIs that the application needs to report on. Key performance indicators (KPIs) are quantifiable measurements employed by organizations to monitor and assess performance. See Allen Smiths dW article Part 1 and 2 on KPIs


Custom business reports - Gain insight from historical data with reporting, scorecards, clustering etc. Custom business reports, also know as descriptive analytics, provides summaries and reports about the sample and about the observations that have been made.
For example, the asset maintenance history of a water pipe is a descriptive statistic that summarizes the quality of a water pipe.


Standard operating procedures - Standard operating procedures (SOPs) can also be launched by an application via the underlying eventing mechanism. SOPs are essential to an organization’s ability to deliver consistent, measured, high-quality responses to complex events.
An SOP might be related to automatically detecting a failure in a sensor and opening a work order to have it repaired, or to dealing with approaching severe weather. Regardless of the reason for the standard operating procedure, if an organization develops a planned, understood (and rehearsed) response to various events it can better respond to that incident quickly, and consistently. See Bob Patten dW article on SOPs.

Friday, August 30, 2013

What is a Content Pack?

When I talked about building water applications using IBM Smarter Water SDK, I omitted a key ingredient needed by the application, its content. For and application to function it needs supporting content such as; data, business reports, key performance indicators (KPIs), and standard operating procedures (SOPs). In the Smarter Water SDK, the application's content comes in the form of a content pack. We can think of a content pack as a container that holds lots of different types of content, content that that be both consumed and produced by the application. Here is a diagrammatic representation of the Smarter Water application content pack.

Smarter Water Content Pack

Application development using IBM Smarter Water SDK follows an model-view-controller pattern (MVC). Using this pattern; the application is the controller, the content pack is the model, and the Smarter Water Platform provides the view (other views can be plugged in here as well). This allows the content to be changed independent of the application so that we can easily add new KPIs and custom reports as our understanding of the application grows. We will come back to this topic again in a later blog.

IBM's Smarter Water SDK Model View Controller Pattern


Let us examine the content of the content pack in more details


Data sources - Understand the external systems (e.g. work equipment: devices, sensors, meters, etc)

Identify the external system that the application needs to pull data from, or interface to, in order to function. Example of such external systems are; (water) meter devices, sensors devices, loggers, enterprise asset management systems (EAM), customer relationship management systems (CRM), GIS systems, ERP system etc.. Once these particular systems are identified the application developer much also understand the format of the data that is been external systems provide. The data in on-boarded using an enterprise service bus and mediations are responsible for routing the data to the various sub systems and data stores.


Events - The enterprise service bus and the mediations are also responsible for handling and dealing with events. These events can be external event such as a weather event, or events from the meters and sensor devices, such as a no read. These events can also be generated by the application. 


Database extensions – Create the corresponding application specific IOW persistence stores 

Based on the format of the data from the external systems, such as the measurements and measurement values from sensor or meters, the corresponding database stores need to be created within the Smarter Water Platform. Examples of the kind of data stores that an application developer may want to create would be; reporting, operational, analytics and geospatial persistence data stores


Water information hub/Semantic model - Extend the IOW Semantic Model to support the clients water model

Based on the application requirements and the types of external systems the semantic model, at the heart of the Smarter Water Platform (IOW), can be extended to model these systems to provide a overall view of the water network. This semantic model also allows the application to perform meaningful queries, fine grained filtering validation and inferencing. For more information see Tim Hanis dW article on using semantic models.


Key Performance Indicators (KPIs) - Create application specific KPIs

Discover, specify and implement the KPIs that the application needs to report on. Key performance indicators (KPIs) are quantifiable measurements employed by organizations to monitor and assess performance. See Allen Smiths dW article Part 1 & 2 on KPIs


Custom business reports - Gain insight from historical data with reporting, scorecards, clustering etc.

Custom business reports, also know as descriptive analytics, provides simple summaries about the sample and about the observations that have been made. Such summaries may be either quantitative, i.e. summary statistics, or visual, i.e. simple-to-understand graphs. These summaries may either form the basis of the initial description of the data as part of a more extensive statistical analysis, or they may be sufficient in and of themselves for a particular investigation.
For example, the asset maintenance history of a water pipe is a descriptive statistic that summarizes the quality of a water pipe. 


Standard operating procedures

Standard operating procedures (SOPs) can also be launched by an application via the underlying eventing mechanism. SOPs are essential to an organization's ability to deliver consistent, measured, high-quality responses to complex events. An SOP might be related to automatically detecting a failure in a sensor and opening a work order to have it repaired, or to dealing with approaching severe weather. Regardless of the reason for the standard operating procedure, if an organization develops a planned, understood (and rehearsed) response to various events it can better respond to that incident quickly, and consistently. See Bob Patten dW article on SOPs.


Advanced analytics algorithms

The  Smarter Water SDK also gives application developer access to three types of, advanced business analytics such as; descriptive Analytics (historical insights), prescriptive/optimization analytics (optimization), and predictive Analytics (predication). We have already addressed descriptive analytics in the custom reporting section and this section of the content pack deals with any algorithms needed for optimization or predicative analytics. An example here would be a predicative algorithm that is used to predict when pipes are going to fail.


In the next blog we will look at building out a content pack for the pressure management application 

Friday, June 21, 2013

The best way to deal with a leaky pipe

At the heart of the IBM Smarter Water product is the water information hub (WIH), can be viewed as a system, where the whole is greater than the sum of the parts. In a previous post I talked about how we can create intelligent apps on top of the WIH using IBM Smarter Water SDK, where these apps can then collaborate together to optimizing the water network by exploiting feedback loops in the system. In this post we will examine another feature of the system, that is the ability for the WIH to learn new stuff.

Usually, when we architect and design applications we store the data in a database. Databases are very good at storing and querying data but one drawback is that all of the data has to known at design time. For example, when we are building a database for a metering system we need to know everything about the metering system at design time. The problem with a dynamic system like the WIH, where the whole is greater than the sum of the parts, is that by definition the 'whole' know more than the 'parts'. In other words we can not possibly know all of the information contained in the 'whole' at design time. 

An example will help illustrate this. Lets return to the water balance application we previously built using IBM Smarter Water SDK. The water balance app measures the amount of water in and out of the system. In a water distribution system, the network is typically divided into a number of pressure zones. In the diagram bellow we can see five separate pressure zones. The water balance application reads data from the water information hub, which is connected at the backend to the sensors and meters in the network, and reports a standard measure of water (IWA) moving in and out of the network. The water balance application provides us with a baseline from which we can start to optimize the water network. By running a minimum night flow analysis, the water balance application can determine which pressure zone is the most 'leaky' in the water network (1). The problem here is, if we we architected the WIH with a database, the concept and corresponding database construct, for 'leakiness', may not have been considered at design time since we could not have foreseen all the apps that could be built on top of WIH at design time.

A water distribution with five separate pressure zones
The WIH bypasses this problem by using a semantic technology, rather than a database technology to represent the water network. I will go into the details of the semantic technology in a later posting but suffice to say that by using a semantic technology we can now add new data at runtime that was not thought about at design time.


Now, once the water balance app runs the minimum night flow analysis and categories the pressure zones by 'leakiness' it can write this information back to the WIH (2). The pressure management app can then use this new information (3) to prioritize which pressure zones it needs to optimize first.

This is just one example of where a water app that processes data from the water information hub has enhanced our understanding of the water system and can then make that new information available to other applications. This is because the semantic technology, that the water information hub is based on, is dynamic enough to allows us to make these changes at runtime. There are lots of other examples of applications that can enhance our understanding of the water network, and we will be looking at others in a future postings.


Friday, May 24, 2013

Cooperating applications for self optimizing water systems

People often ask me what is the importance of the water information hub (WIH)? The WIH provides a system view of the water network, where the whole is greater than the sum of the parts. In other words is not just  an elemental view of the water meters, or the sensor (pressure, flow, turbidity etc), or the assets (pipes, manholes, value, pumps, etc) in the system, it shows how all these elements, and many more, interrelate with each other. We can now treat the WIH as a system and like all other systems it exhibits certain characteristic of a system such as feedback loops. A simple example of a system with a feedback look is a house with thermostat. A thermostat works with a furnace and you set the thermostat to a certain temperature and the furnace works with the thermostat, blowing on and off, to keep the house at that set temperature. Here there is a feedback look between the thermostat and the furnace. For a great book on understand more about systems and systems behaviors, including feedback loops, see the book: Thinking in Systems: A Primer.

The very same can be done for a water distribution network where we have water flowing into and out of the network from the tap, or from from leaks, or from fire hydrants. Water lost from the systems that is not billed through a meter is called non revenue water (NRW). We can create similar feedback loop for the WIH by measuring the amount of water in and out of the system and then optimizing that via some feedback loop mechanism to help minimise the amount of NRW. The example we will look at is very similar to the thermostat example above in that is there are also two applications cooperating together: a water balance application that measures the amount of water in/out of a network and a pressure management application that will optimize the pressure in the network. Both of these application can be build using the IBM's Smarter Water SDK
Water Balance Table
In any system it is always important to get the beat of the system. In a water distribution network this is how much water is flowing through the network and were the water is going to. A measure of a beat of a water network can be provided by a water balance table. In a water distribution network, the network is typically divided into pressure zones, as this makes it easier for a water authority to manage the pressure across a large network and allows for a sub section of pipes to be kept at a constant pressure independent of the rest of the water network. A water balance application built using the SDK could read in the pipe network data and the associated meter readings from the pipe network, and then calculate and display the water balance. The figure above shows a standard water balance report that the water balance application might produce. One of the things a water balance application can do, is run a minimum night flow analysis, which runs the water balance at 3.00 AM, when water usage is at it's lowest, and all of the losses of water in the system at that time are largely due to leaks. By comparing pressures zone, using a minimum night flow analysis, we can then determine which pressure zones are having the most leaks.

Multiple pressure zones and a minimum night flow analysis chat

A pressure management application works on the principle, that within a pressure zone, pressure in usually kept high to ensure that there is adequate positive pressure on the tap side.  Keeping the water network at high pressure all the time has a detrimental effect on the pipe network, particularly in an aging pipe network, which is the case in most western european cities. The constant high pressure tends to corrode the pipes and also exasperates any existing leaks. A pressure management application, built using SDK, will read off the pipe network and then iterate through the pipe network and read off the pressure reading at pressure critical point and then take that data and process it through an optimization algorithm. The output of the optimization algorithm will then give the optimized pressure readings for that pressure zone. The application could then write out to the pressure reducing values, in that pressure zone. using an OPC interface and set the optimized pressure value for the network.
Feedback loop between the water balance and the pressure management applications 
These two applications, the water balance application and the pressure management application can be set up in a feedback loop very similar to how the thermostat and the furnace feedback on each other. This kind of collaboration between the two application can be done simply with a pub/sub interface on the applications. The water balance application alerts, the pressure management application, that a particular pressure zone is very leaky. The pressure management application optimize the pressure in that pressure zone. Once the pressure management application runs and optimizes the pressure in the pressure reducing values and then in turn alerts the water balance application that the pressure has been optimized. The water balance application would then run the minimum night flow analysis again, the following night, and find by how much the leaks have been reduced.

Rain to drain water network

In this feedback loop between the water balance application and the pressure management application, the water balance application may tell the pressure management application to use a different optimization algorithm and test the effectiveness of one algorithm against another. There are many more of these feedback loops that you can find in the water network, such as the rain to drain picture above in Peter Williams paper, and we challenge you find more and build collaborating applications around those.


Sunday, May 19, 2013

Application development using IBM's Smarter Water SDK

Last week IBM quietly released a new version of its Smarter Water product (called the Intelligent Operations for Water). Buried inside of this release is a feature that looks to completely change the way water applications are developed. The new version supports an application development model that allows for third parties to build water applications (such as leak detection, flood management, water quality applications) quickly and consistently on the Smarter Water platform. The benefits of such an application development approach is that it provides one way of building water applications, including mobile applications, on the platform.

Apple revolutionized the consumer world with their iPhone/iPad app store providing developers with access to the iOS platform and allowed them to build their own applications. Apple also provided an App Store where application developer could advertise and sell the applications. The Smarter Water platform now follows this model but instead of targeting customers, it targets a range of 3rd party water applications developers from research groups (including universities), services provider and partners, to developer their own smarter water applications.

IBM's Smarter Water SDK

The Smarter Water platform provides this application development capability by providing a software development kit (SDK) for water application developers.  The SDK consists of a set of underlying interfaces and programming model to enable and simplify application development as well as number of examples to help guide and educate application developers.  The SDK consists of three core interfaces. 

  • An interface into the water information hub (WIH), which gives an application access any and all water, related assets, such as the water pipe network, pumps, sensor, meters, etc. 
  • An interface into the advanced analytics engines of the platform, which gives an application developer access to three types of, advanced analytics such as descriptive Analytics (historical insights), prescriptive/optimization analytics (optimization), and predictive Analytics (predication)
  • An interface into a rendering service, which allows the application developer to create a resulting information layer which can then be put on top of a map.
Detailed documentation about this SDK and these interfaces, written by our fearless Dublin based documentation team, can be found here: http://ibm.co/1ANClFk

The Smarter Water SDK interfaces allows us to build smart water applications

Using these three interfaces, the core pattern for application development is very simple. 
  1. The application will read the types of water asset from the water information hub (WIH) e.g. pump, pipe, valves, sensors, meters, etc. This is because the WIH has a self-describing interface. 
  2. The application will then focus on a particular asset such a pipe and then read the pipe network from the WIH, for a particular pressure zone. The application could also iterate through the pipe network and read off the meter reading in that pipe network. 
  3. The application may then do some advanced analytics on the pipe network, such as checking which meters are reading high. 
  4. The application can then create a layer of the pipe network and color the particular of the network with high meter reading in red and then display that pipe network on a map.
A complete tutorial details a factious water company called the Sunshine Water Group (SWG) who manage a water network for a regional council. The water network contains a number of sensors that monitor measurements. Sunshine Water Group have been experiencing challenges with water pressure measurements in their pipe infrastructure. Each pipeline asset in the water network has the following managed components: pipes, junctions, reservoirs, valves and tanks. Each managed component has an associated measurement. For example, both junctions and valves have pressure readings, measured in psi (force per square inch). Sunshine Water Group use valves to set pressure readings. The rest of the tutorial shows how to build out, using the SDK, a simple pressure management application and deploy it onto the Smarter Water platform.

In an up coming Smarter Planet Blog posting I will be teaming up with the Smarter Water Product Manager, Nitin Kapoor and Dr Sean Mckenna from IBM Dublin water research laboratory to talk more about the SDK and the Smarter Water platform.


Wednesday, April 17, 2013

Cooperating systems of water

If Henry Ford were alive today in the internet era of Facebook, Google and Twitter, the last thing he would do is startup another internet company. Instead he look to provide an organizing principle that would leverage and streamline business to catapult them into the next age of business development. Ford would look to streamline and enable collaborative business development to allow businesses to mass produce, in the internet environment, in the same way as he did with the assembly line for the automotive business at the start of the 20th century.

In 1913 Henry Ford caused a paradigm shift in the automotive business by leveraging the assembly line to streamline car manufacture. While Ford did not invent the assembly line, his sponsorship of its development and his use of it as an organizing principle to streamline manufacture, was central to its explosive success in the 20th century. Ford major contribution was not in the invention of anything new in terms of automotive manufacturing it was about providing an organizing principle that effectively and efficiently leveraged existing technologies in a value added manner.

Today we stand at another tipping point in terms of business evolution. After 20 years of breathtaking internet development, the internet has evolved from simple client server to collaborative social interactions. We have Amazon and eBay to buy stuff, PayPal to pay for stuff, Google to search for stuff, Twitter to tell people about stuff and Facebook to show off our stuff. These are some of the internet giants that have become household names, in the internet landscape of today. Yet impressive as these advances have been, without an organizing principle to allow business to leverage them in a collaborative and added value manner, they will remain a hodgepodge of technologies much like the automotive industry prior to the introduction of the assembly line.

A business centric organizing principle that aligns businesses to allow them to leverage and flexibly combine existing technologies and services will jetism business development into the 21th century. A business framework that will enable businesses to easily collaborate together, with their producers and consumers in a value add fashion, to enabling new business opportunities and strengthening existing ones. This business centric organizing principle is what is needed in today business landscape and will provide the kind of acceleration and enablement that Ford introduced with the assembly line.

Ford’s legacy lives with us today in every assemble line, in every business process and has being the very foundation and building blocks for business for the last 100 years. Today in a rapidly evolving business paradigm not only do we need a new business framework to organize and align business, we also need to think beyond the static and linear business processes and think more in terms of business activities that are achieved by mixing and matching business capabilities in a self optimizing network ecosystem.

A self optimizing ecosystem were business capabilities can be mixed and matched to dynamically realize business activities will allow businesses to become much agile in terms their reactions to new market opportunities and allow for the rapid evolution and realization of new business models.

All of these ideas can be applied to water and can enable a more advanced concept of cooperation, such as cooperation between businesses with the desired result of a solving a water problem. We need to provide an organizing framework that encourages private sector to build business application on top of the instrumented water systems. It helps to think of a business application such as a water meter reading application that exists in a business app store and the organizing principle as organizational categories within the app store. These applications need to be cloud enabled so that we can access them from anywhere. Finally we need to figure a way to allow these business applications to collaborate and cooperate together to achieve some common goal.

We are really just beginning to figure out the smarts and the math behind cloud enabled application cooperation, but a good place to start is with game theory. Game theory is the brain child of a mathematician called John von Neumann and was born in the shadow of the US/USSR nuclear arms race when the super powers were thinking to outthink each other in the face of mutually assured destruction. But game theory can also be applied to the problem of cooperation and collaboration between water related business application produced by different parties to come to achieve a mutually beneficial outcome. We will return to these ideas in future posts.